

Сайт МКПАО «Т‑Технологии»/IPJSC T‑Technologies website (RUS)
MOSCOW — 19 March 2026
IPJSC
-
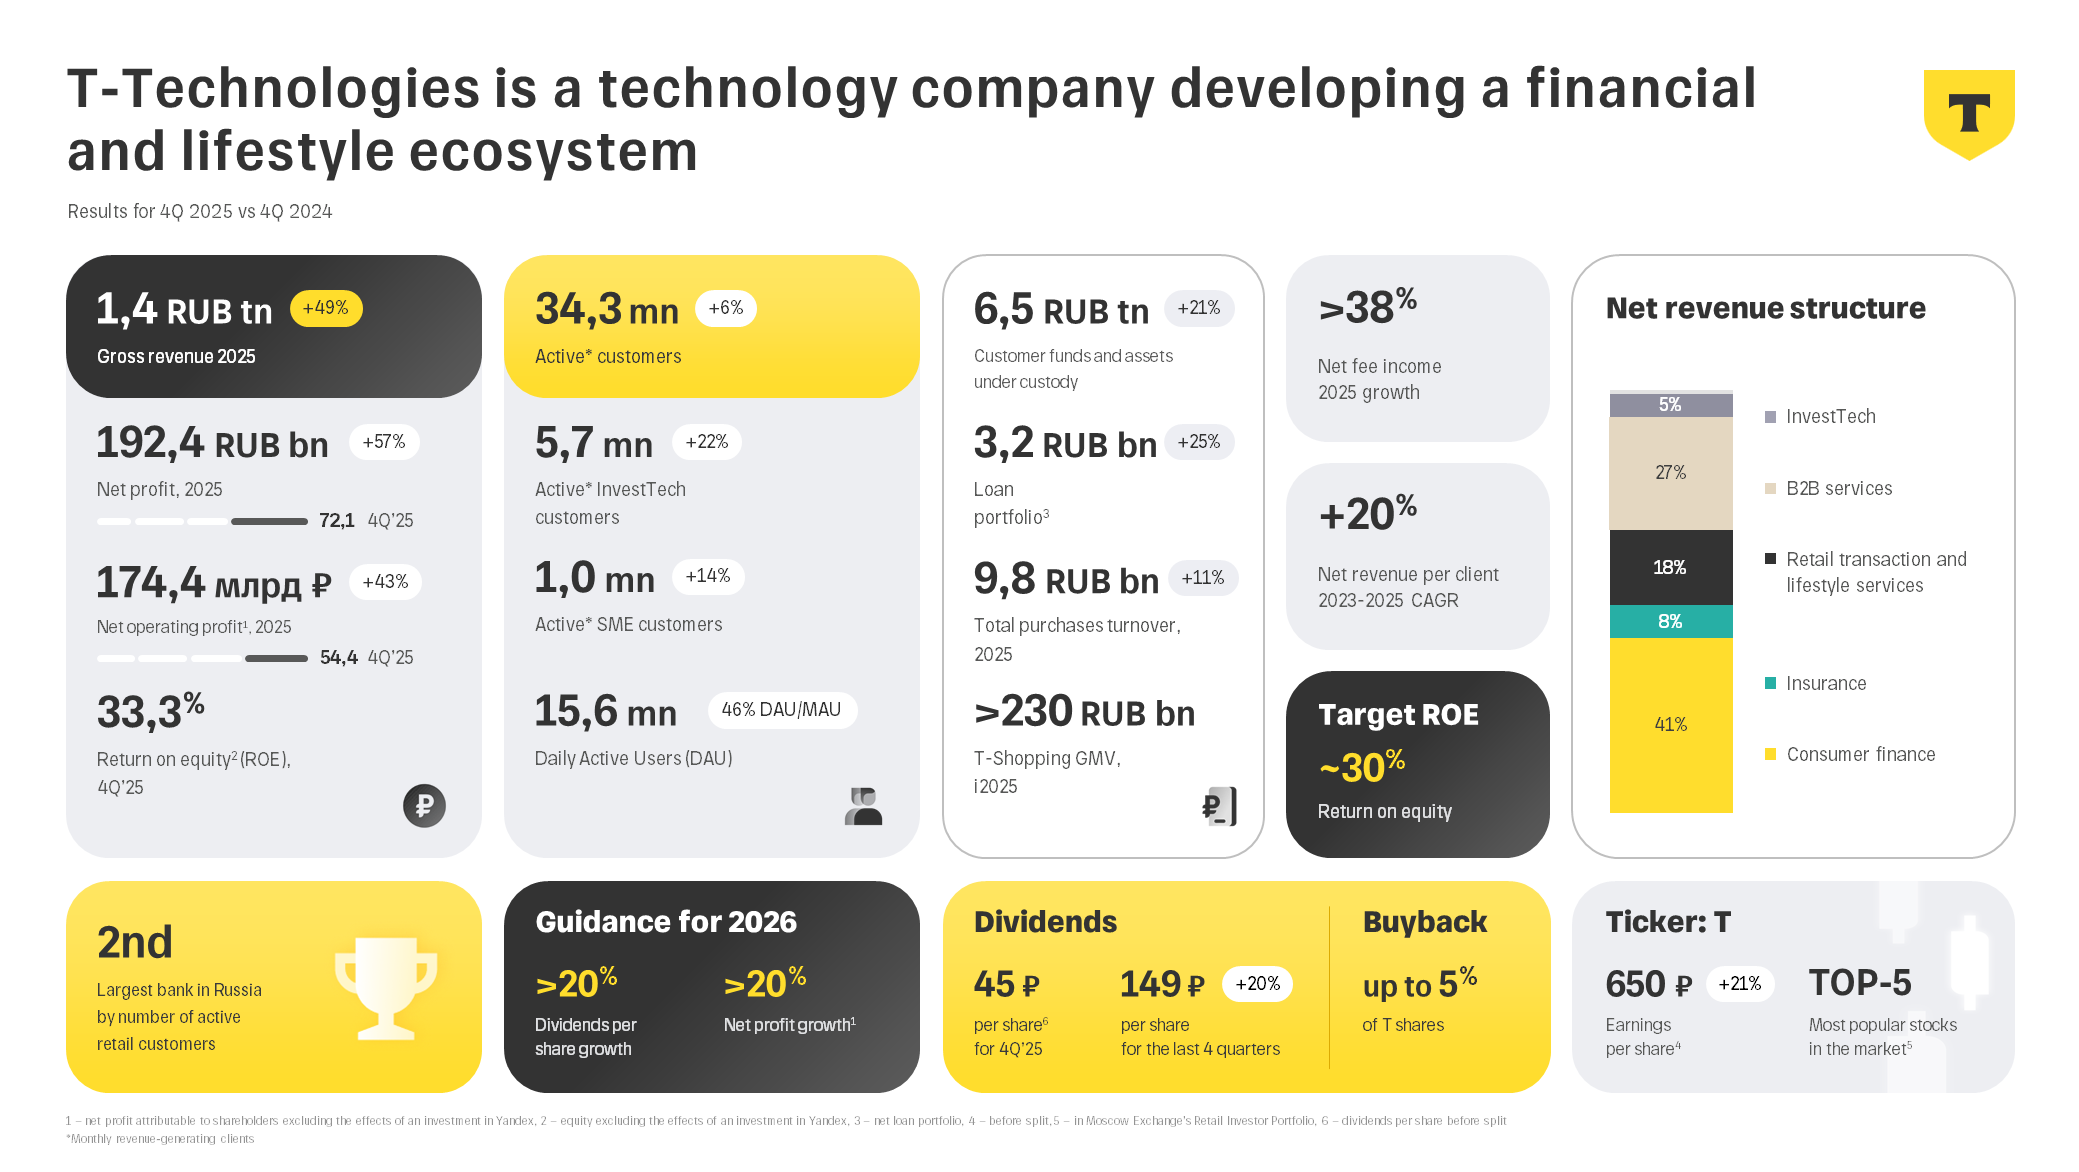
Total revenue in FY 2025 increased by 49%
year-on -year to a record RUB 1.4 tn. -
Total revenue grew by 12%
year-on -year in 4Q’25, amounting to RUB 378 bn. -
The number of monthly active T customers increased by 6%
year-on -year, reaching 34.3 mn as of the end of 2025. -
Operating net profit* attributable to the Group’s shareholders (excluding
non-controlling interest and the effects of the investment in Yandex) increased by 43%year-on -year to RUB 174.4 bn in FY 2025, exceeding the Group’sfull-year guidance. -
Operating net profit in 4Q’25 increased by 41%
year-on -year to over RUB 54.4 bn. -
Return on equity* amounted to 29,1% for FY 2025 and to 33,3% in 4Q’25.
-
2026 guidance: the Group’s operating net profit* is expected to increase by 20% or more, with total annual dividends per share growing by more than 20%.
-
Dividends: the Group’s Board of Directors has recommended dividends of RUB 45 per share for 4Q’25.
The President of
«We continue to strengthen our key operating and financial metrics. Today,
As a global technology leader, our
The Chairman of the Board of Directors of
«
One of our key priorities for 2026 is making T shares more accessible for retail investors. In April, we will carry
out a
We are also continuing the share buyback programme announced in November 2025, targeting up to 10% of T’s free float for
use in our
We are starting the year with investments in the technological transformation of the automotive market, which we see
as one of the key drivers of the Group’s growth in the coming years. The acquisition of the iconic Auto.ru platform,
combined with the
1. KEY OPERATING METRICS
|
T Ecosystem |
4Q |
4Q |
∆ |
3Q |
∆ |
Total customers, mn |
54.1 |
47.8 |
13% |
52.8 |
3% |
Active customers, mn |
34.3 |
32.3 |
6% |
34.0 |
1% |
Active B2B customers, mn |
1.03 |
0.90 |
14% |
0.96 |
7% |
Monthly active users (MAU), mn |
34.0 |
32.5 |
5% |
33.9 |
0% |
Daily active users (DAU), mn |
15.6 |
15.4 |
1% |
15.7 |
-1% |
2. OVERVIEW OF FINANCIAL AND OPERATING PERFORMANCE
|
RUB bn |
4Q |
4Q |
∆ |
3Q |
∆ |
2025 |
2024 |
∆ |
Interest income |
286.2 |
253.3 |
13% |
279.8 |
2% |
1,087.6 |
693.1 |
57% |
Interest expense |
-135.0 |
-124.3 |
9% |
-142.5 |
-5% |
-550.9 |
-302.2 |
82% |
|
Net interest income |
146.9 |
125.2 |
17% |
132.9 |
10% |
520.0 |
379.6 |
37% |
|
Net interest income after provisions |
107.4 |
81.7 |
31% |
86.9 |
24% |
354.8 |
250.0 |
42% |
Fee and commission income |
66.9 |
56.5 |
18% |
60.8 |
10% |
234.6 |
182.4 |
29% |
Fee and commission expense |
-23.3 |
-22.7 |
2% |
-22.3 |
5% |
-88.5 |
-76.8 |
15% |
|
Net fee and commission income |
43.6 |
33.7 |
29% |
38.5 |
13% |
146.1 |
105.6 |
38% |
Total operating expenses |
-98.0 |
-89.2 |
10% |
-90.6 |
8% |
-357.1 |
-278.8 |
28% |
Profit before tax |
93.9 |
48.2 |
95% |
52.9 |
77% |
253.4 |
152.3 |
66% |
Net profit |
72.1 |
38.7 |
86% |
40.1 |
80% |
192.4 |
122.2 |
57% |
Net profit attributable to shareholders |
61.2 |
38.5 |
59% |
40.1 |
52% |
177.0 |
122.4 |
45% |
|
Operating net profit* |
54.4 |
38.5 |
41% |
45.2 |
20% |
174.4 |
122.4 |
43% |
* Attributable to shareholders, excluding the effects of the investment in IPJSC Yandex
|
Ratios |
4Q |
4Q |
∆ |
3Q |
∆ |
2025 |
2024 |
∆ |
Return on equity (ROE)* |
33.3% |
30.2% |
3.1 p.p. |
29.2% |
4.1 p.p. |
29.1% |
32.6% |
-3.5 p.p. |
Net interest margin |
11.3% |
11.0% |
0.3 p.p. |
10.9% |
0.4 p.p. |
10.8% |
11.8% |
-0.9 p.p. |
Cost of risk |
4.9% |
6.5% |
-1.6 p.p. |
6.1% |
-1.2 p.p. |
5.7% |
7.3% |
-1.6 p.p. |
* Operating return on equity attributable to shareholders, excluding the effects of the investment in IPJSC Yandex
|
RUB bn |
31 December |
31 December |
∆ |
30 September |
∆ |
Total assets |
6,084 |
5,118 |
19% |
5,700 |
7% |
Net loans and advances to customers |
3,169 |
2,537 |
25% |
2,938 |
8% |
Cash and cash equivalents |
1,235 |
1,427 |
-13% |
1,190 |
4% |
Liabilities |
5,279 |
4,597 |
15% |
4,954 |
7% |
Customer accounts |
4,412 |
4,010 |
10% |
4,244 |
4% |
Total equity |
805 |
521 |
54% |
747 |
8% |
Total equity attributable to shareholders |
684 |
520 |
32% |
634 |
8% |
|
Operating equity* |
675 |
520 |
30% |
632 |
7% |
* Attributable to shareholders, excluding the effects of the investment in IPJSC Yandex
|
Ratios |
31 December |
31 December |
∆ |
30 September |
∆ |
Share of NPLs |
7.2% |
5.8% |
1.4 p.p. |
7.2% |
0 p.p. |
Tier 1 capital ratio |
13.0% |
12.8% |
0.2 p.p. |
14.0% |
-0.9 p.p. |
Total capital ratio |
13.0% |
12.8% |
0.2 p.p. |
14.0% |
-0.9 p.p. |
The number of active T customers increased by 1%
Total turnover from customer purchases in FY 2025 amounted to RUB 9.8 tn, an increase of 11%
In FY 2025,
Gross yield on the loan portfolio was 25,6% in 4Q’25 (4Q’24: 26,4%), reflecting changes in both the loan product mix and interest rates. The yield on the Group’s securities portfolio reached 12,2% (4Q’24: 11,0%).
Interest expense increased by 82%
Net interest income increased by 37%
The cost of risk declined to 5,7% in FY 2025 (FY 2024: 7,3%), and it was 4,9% in 4Q’25, versus 6,1% in the
previous quarter (4Q’24: 6,5%). The
As of the end of 4Q’25, the Group had 54.1 million customers, including:
46.7 mn daily banking and lifestyle customers;
-
9.7 mn
T-Investments customers; 1.6 mn customers in the SME segment.
In FY 2025, total operating expenses increased by 28%
Operating net profit attributable to the Group’s shareholders, excluding the effects of the investment in IPJSC Yandex, increased
by 43% in FY 2025, amounting to RUB 174 bn (4Q’25: RUB 54 bn, up 41%
In FY 2025,
The Group’s net loan portfolio increased by 25%
The Group’s NPL ratio was 7,2% (31 December 2024: 5,8%). Loan loss reserves exceeded NPLs by 1,2x.
Total customer funds along with assets under management amounted to RUB 6.5 tn, an increase of 21%
The Group’s equity grew by 54% to RUB 805 bn (31 December 2024: RUB 521 bn).
The Group’s financial statements will be available on its website: https://t-technologies.ru and https://t-technologies.ru/results/.
For enquiries:
Current information on
Important Legal Information
The information and statements contained or referred to in this announcement do not constitute or form part of, and should not be construed as, any public offer under any applicable legislation or an offer to sell or solicitation of any offer to buy any securities or financial instruments or any advice or recommendation with respect to such securities or other financial instruments. The distribution of this document in certain jurisdictions may be restricted by law. Recipients are required by the Group to inform themselves about and to observe any such restrictions. No liability to any person is accepted in relation to the distribution or possession of this document in any jurisdiction.
Some of the information in this announcement may contain projections or other
About T-Technologies
T-Technologies is a technology company that is developing an ecosystem of financial and lifestyle services. Branchless since its inception in 2006, company developed a full range of in-house proprietary technology solutions and services, including digital banking, brokerage, acquiring and other merchant solutions, insurance, SME banking and much more.
**The dividend amount is indicated on a
Related News