

Сайт МКПАО «Т‑Технологии»/IPJSC T‑Technologies website (RUS)
MOSCOW — 11 August 2026.
br IPJSC
2Q and 1H 2026 financial results
-
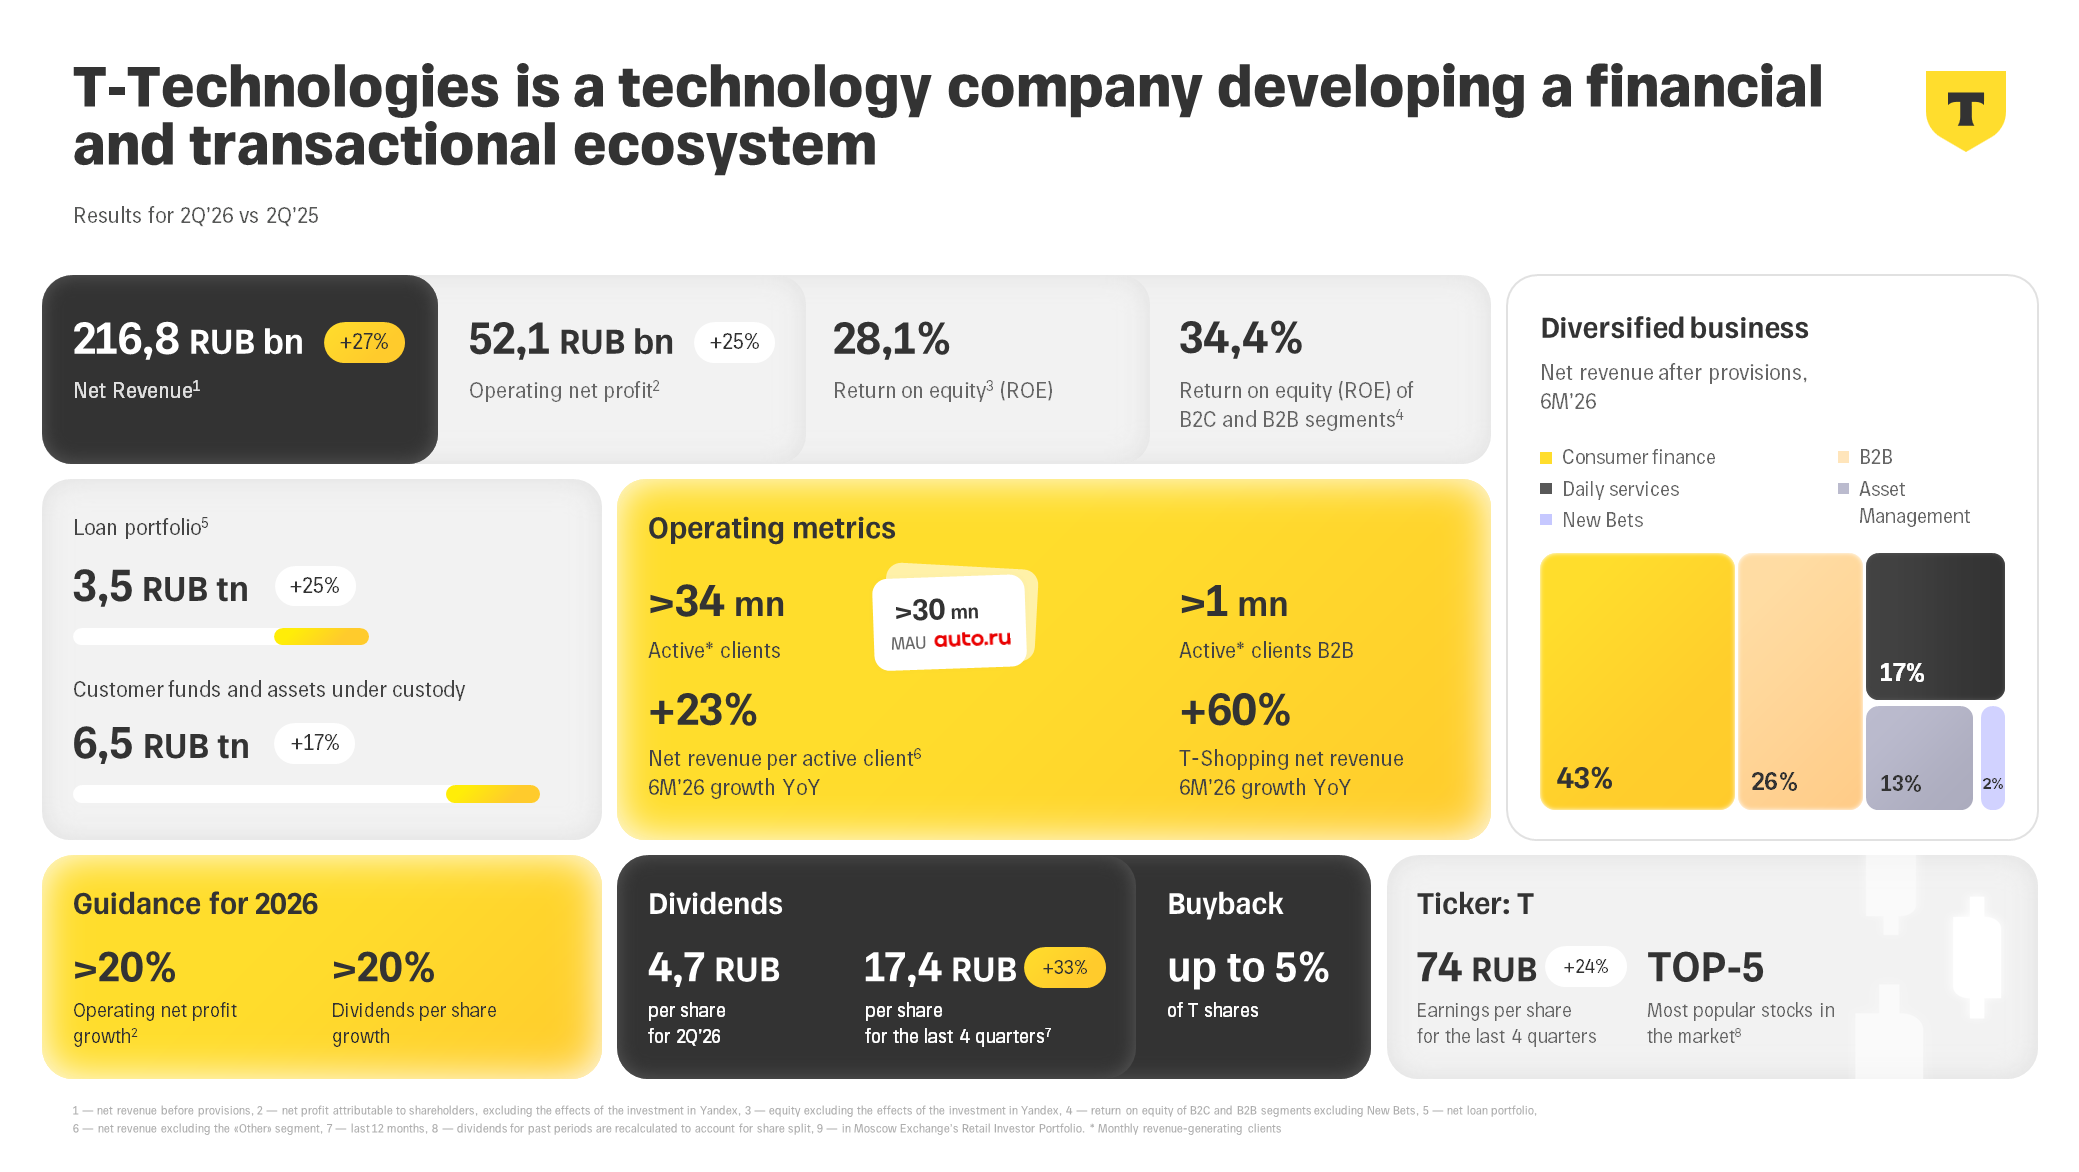
Net revenue increased by 27%
year-on-year in 2Q to RUB 216.8 bn, driven by ecosystem expansion and higher customer engagement. In 1H, net revenue grew 26%year-on-year to RUB 414.2 bn. -
Operating net profit* increased by 25%
year-on-year in 2Q to RUB 52.1 bn, reflecting the business’s focus on efficiency. In 1H, operating net profit* rose 31.7%year-on-year to RUB 98.6 bn. - The Group’s return on equity (ROE)* amounted to 28.1% in 2Q, while ROE across key B2C and B2B operating segments reached 34.4%. In 1H, ROE* increased to 27.4%, while ROE across key B2C and B2B operating segments rose to 33.8%.
- 2026 guidance confirmed: operating net profit growth of 20% or more, with total dividends per share for the year expected to increase by more than 20%.
Key corporate developments
- Regular quarterly dividends: the Board of Directors recommended a dividend payment of RUB 4.7 per share based on 2Q 2026 results.
- Share buyback: the Group continues to repurchase T shares implementing its buyback programme up to 5% of share capital (equivalent to up to 10% of free float).
The President of
«We continue to scale the business efficiently, supported by a loyal customer base numbering in the tens of millions, hundreds of products addressing various needs, innovative technologies and platform solutions. Our strategic focus on developing an ecosystem approach powered by AI technology enables us to increase net revenue per active customer, which rose by 23% in 1H 2026. Growing trust in T is also reflected in our increasing share of lending and customer funds among individuals and businesses in Russia. At the same time, the Group continues to deliver strong efficiency: operating net profit increased by 32% in 1H 2026, while ROE across our key B2C and B2B operating segments reached 33.8%.
One of the key developments for
The Chairman of the Board of Directors of
«
We continue to target growth of 20% or more in both the Group’s operating net profit and dividends per T share
in 2026. In our view,
1. KEY OPERATING METRICS
T Ecosystem |
2Q 2026 |
2Q 2025 |
YoY ∆ |
1Q 2026 |
QoQ ∆ |
Total customers, mn |
55.7 |
51.4 |
8% |
54.9 |
1% |
Active customers, mn |
34.3 |
33.5 |
2% |
34.2 |
0% |
Active B2B customers, mn |
1.04 |
0.94 |
11% |
1.03 |
2% |
Monthly active users (MAU), mn |
34.0 |
33.5 |
2% |
34.0 |
0% |
Daily active users (DAU), mn |
15.4 |
15.5 |
-1% |
15.4 |
0% |
The number of active customers in the T ecosystem generating revenue each month amounted to 34.3 mn in 2Q 2026.
As at the end of June 2026, T’s total customer base reached 55.7 mn, up 8%
Monthly active users (MAU) increased by 2%
The Group also continues to strengthen its position in business services. The number of active B2B customers increased by 11%
2. KEY FINANCIAL RESULTS
Key financial metrics (RUB bn) |
2Q 2026 |
2Q 2025 |
∆ |
1Q 2026 |
∆ |
1H 2026 |
1H |
∆ |
Interest revenue |
282.6 |
261.2 |
8% |
276.1 |
2% |
558.7 |
515.1 |
8% |
Service and insurance revenue |
122.1 |
106.4 |
15% |
111.1 |
10% |
233.2 |
204.1 |
14% |
Revenue |
404.7 |
367.6 |
10% |
387.2 |
5% |
791.9 |
719.2 |
10% |
|
|
||||||||
|
Net interest income |
157.6 |
119.6 |
32% |
144.7 |
9% |
302.3 |
231.0 |
31% |
|
Net service (fee and commission) income |
46.4 |
40.2 |
15% |
42.9 |
8% |
89.3 |
75.9 |
18% |
|
Net insurance income |
12.8 |
11.2 |
14% |
9.8 |
31% |
22.6 |
22.2 |
2% |
Net revenue |
216.8 |
171.0 |
27% |
197.4 |
10% |
414.2 |
329.1 |
26% |
Net revenue after provisions |
175.3 |
125.0 |
40% |
151.9 |
15% |
327.2 |
249.4 |
31% |
Marketing and customer acquisition costs |
-34.7 |
-27.5 |
26% |
-28.5 |
22% |
-63.2 |
-49.0 |
29% |
Other administrative expenses |
-74.5 |
-61.4 |
21% |
-71.3 |
4% |
-145.8 |
-121.8 |
20% |
Profit before tax |
53.1 |
62.0 |
-14% |
44.5 |
19% |
97.6 |
106.7 |
-9% |
Net profit |
39.5 |
46.7 |
-15% |
35.0 |
13% |
74.5 |
80.2 |
-7% |
Net profit attributable to shareholders |
44.3 |
42.5 |
4% |
38.8 |
14% |
83.1 |
75.7 |
10% |
Operating net profit* |
52.1 |
41.6 |
25% |
46.5 |
12% |
98.6 |
74.9 |
32% |
|
|
||||||||
|
For reference: Adj. EBITDA |
101.6 |
76.2 |
33% |
82.9 |
23% |
184.5 |
136.2 |
35% |
In 2Q 2026,
Net revenue grew 27%
Operating net profit attributable to the Group’s shareholders, excluding the effects of the investment in IPJSC Yandex, increased by 25% in 2Q 2026 to RUB 52.1 bn (2Q 2025: RUB 41.6 bn). As a result, the Group’s return on equity* amounted to 28.1% in 2Q 2026 (2Q 2025: 28.4%), while ROE across key B2C and B2B operating segments reached 34.4%.
|
Ratios |
2Q 2026 |
2Q 2025 |
∆ |
1Q 2026 |
∆ |
1H |
1H |
∆ |
|
Loan portfolio yield |
23.8% |
25.6% |
-1.8 p.p. |
23.8% |
0 p.p. |
23.7% |
25.4% |
-1.7 p.p. |
|
Net interest margin |
11.6% |
10.6% |
1 p.p. |
10.9% |
0.7 p.p. |
11.2% |
10.2% |
1 p.p. |
|
Cost of risk |
4.7% |
6.7% |
-2 p.p. |
5.3% |
-0.7 p.p. |
5.0% |
5.9% |
-0.9 p.p. |
Operating net profit margin* |
24.0% |
24.3% |
-0.3 p.p. |
23.6% |
0.4 p.p. |
23.8% |
22.8% |
1 p.p. |
|
|
47.6% |
46.0% |
1.5 p.p. |
47.3% |
0.2 p.p. |
47.4% |
47.0% |
0.5 p.p. |
Return on equity (ROE)* |
28.1% |
28.4% |
-0.3 p.p. |
26.7% |
1.4 p.p. |
27.4% |
26.6% |
0.9 p.p. |
ROE of key B2C and B2B operating segments |
34.4% |
27.6% |
6.7 p.p. |
33.2% |
1.2 p.p. |
33.8% |
27.5% |
6.3 p.p. |
During the reporting period, the Group maintained its focus on operating efficiency. The operating net profit margin increased
The cost of risk amounted to 4.7% in 2Q 2026, down from 6.7% in 2Q 2025 and 5.3% in 1Q 2026. The loan portfolio yield amounted to 23.8% in 2Q 2026 (2Q 2025: 25.6%), reflecting changes in the loan product mix and in interest rates. Net interest margin amounted to 11.6%, compared with 10.6% in 2Q 2025.
Key balance sheet metrics (RUB bn) |
30 June 2026 |
30 June 2025 |
YoY ∆ |
31 March 2026 |
QoQ ∆ |
Assets |
6,272 |
5,329 |
18% |
5,933 |
6% |
|
Net loans |
3,460 |
2,776 |
25% |
3,241 |
7% |
|
Cash and cash equivalents |
922 |
975 |
-6% |
803 |
15% |
Liabilities |
5,403 |
4,603 |
17% |
5,096 |
6% |
|
Customer accounts |
4,369 |
3,935 |
11% |
4,176 |
5% |
Equity |
869 |
726 |
20% |
837 |
4% |
|
Equity attributable to shareholders |
757 |
613 |
23% |
720 |
5% |
Operating equity* |
764 |
606 |
26% |
719 |
6% |
In 2Q 2026,
The Group’s net loan portfolio increased by 25%
Loan portfolio quality metrics |
30 June 2026 |
30 June 2025 |
YoY ∆ |
31 March 2026 |
QoQ ∆ |
|
Share of NPLs |
7.3% |
6.5% |
0.8 p.p. |
7.5% |
-0.2 p.p. |
Loan loss allowance ratio |
9.3% |
8.8% |
0.5 p.p. |
9.4% |
-0.1 p.p. |
The share of
The total volume of customer funds held in Group accounts and assets under management amounted to RUB 6.5 tn, up 17%
The Group’s equity grew by 20% to RUB 869 bn (30 June 2025: RUB 726 bn). All key capital adequacy ratios remained comfortably above the required levels.
Capital adequacy ratios |
30 June 2026 |
30 June 2025 |
YoY ∆ |
31 March 2026 |
QoQ ∆ |
|
Tier 1 capital adequacy ratio |
11.8% |
12.7% |
-0.9 p.p. |
12.3% |
-0.5 p.p. |
|
Total capital adequacy ratio |
12.9% |
14.0% |
-1.1 p.p. |
13.5% |
-0.6 p.p. |
2.1 BUSINESS SEGMENT RESULTS
The table below presents the Group’s IFRS financial results across six separate segments in line with the current logic of Group’s development as a technology ecosystem built around customer needs. The Group has disclosed its results in this format since 1Q 2026 to enhance reporting transparency and provide a fuller view of the contribution made by individual areas of the T ecosystem to the Group’s financial performance.
Key business metrics by segment, RUB bn |
2Q 2026 |
2Q 2025 |
∆ |
1H |
1H |
∆ |
|
|
Daily Services |
Net revenue |
32.1 |
30.0 |
7% |
56.9 |
58.9 |
-3% |
Adj. EBITDA |
6.6 |
3.3 |
2.0x |
10.1 |
8.1 |
25% |
|
Profit before tax |
-0.9 |
-2.6 |
-/- |
-4.2 |
-3.5 |
-/- |
|
Savings and Investment Services |
Net revenue |
24.0 |
14.8 |
62% |
43.7 |
24.3 |
80% |
Adj. EBITDA |
13.6 |
13.8 |
-1% |
27.8 |
17.6 |
58% |
|
Profit before tax |
12.0 |
11.5 |
4% |
22.9 |
13.1 |
75% |
|
Consumer Finance |
Net revenue |
106.9 |
78.5 |
36% |
212.0 |
154.5 |
37% |
Profit before tax |
48.3 |
20.9 |
2.3x |
94.8 |
51.8 |
83% |
|
|
|
|||||||
Total Retail Business (B2C) |
Net revenue |
163.0 |
123.3 |
32% |
312.6 |
237.7 |
32% |
Profit before tax |
59.4 |
29.8 |
2.0x |
113.5 |
61.4 |
85% |
|
|
|
|||||||
B2B |
Net revenue |
57.0 |
48.9 |
17% |
107.8 |
91.4 |
18% |
Profit before tax |
22.0 |
22.4 |
-2% |
38.1 |
39.5 |
-4% |
|
|
|
|||||||
New Business Streams |
Net revenue |
3.7 |
2.7 |
37% |
6.9 |
4.3 |
60% |
Adj. EBITDA |
-2.6 |
-1.6 |
-/- |
-4.5 |
-3.9 |
-/- |
|
Profit before tax |
-4.1 |
-2.6 |
-/- |
-7.0 |
-5.6 |
-/- |
|
Other |
Net revenue |
-6.9 |
-3.9 |
-/- |
-13.1 |
-4.3 |
-/- |
Adj. EBITDA |
4.8 |
10.6 |
-55% |
2.3 |
9.9 |
-77% |
|
The retail business continued to deliver steady growth in 2Q 2026: aggregate net revenue across the relevant segments increased
by 32%
Daily Services: net revenue grew 7%
Savings and Investment Services: net revenue grew 62%
Consumer Finance: net revenue grew by 36%
B2B: net revenue increased by 17%
New Business Streams: net revenue increased by 37%
Other (strategic initiatives): the segment’s results primarily reflect the market revaluation of the Group’s stake in IPJSC Yandex and cash flows related to financing the transaction.
CALCULATION OF ADJUSTED EBITDA AND OPERATING NET PROFIT
RUB bn |
2Q 2026 |
2Q 2025 |
∆ |
1H 2026 |
1H |
∆ |
Profit before tax |
53.1 |
62.0 |
-14% |
97.6 |
106.7 |
-9% |
|
Interest expense of |
6.9 |
3.4 |
2.0x |
13.4 |
3.4 |
3.9x |
|
Depreciation and amortisation of property and equipment, intangible assets and |
12.3 |
10.5 |
17% |
25.2 |
19.7 |
28% |
|
Finance lease expenses |
1.1 |
0.9 |
22% |
2.2 |
1.8 |
22% |
EBITDA |
73.4 |
76.8 |
-4% |
138.4 |
131.6 |
5% |
|
|
6.4 |
5.1 |
25% |
10.9 |
10.3 |
6% |
|
Yandex revaluation and results attributable to |
21.8 |
-5.7 |
-/- |
35.2 |
-5.7 |
-/- |
Adjusted EBITDA |
101.6 |
76.2 |
33% |
184.5 |
136.2 |
35% |
|
|
|
|
|
|
|
|
Net profit |
39.5 |
46.7 |
-15% |
74.5 |
80.2 |
-7% |
|
|
4.8 |
-4.3 |
-/- |
8.6 |
-4.5 |
-/- |
|
Revaluation of investment in Yandex attributable to the Group’s shareholders |
6.1 |
-2.1 |
-/- |
11.1 |
-2.1 |
-/- |
|
Interest expense on borrowings attributable to the Group’s shareholders |
1.7 |
1.3 |
35% |
4.4 |
1.3 |
3.5x |
Operating net profit |
52.1 |
41.6 |
25% |
98.6 |
74.9 |
32% |
The Group’s financial statements will be available on its website:
https://
For enquiries:
media@
Current information on
Important Legal Information
The information and statements contained or referred to in this announcement do not constitute or form part of, and should not be construed as, any public offer under any applicable legislation or an offer to sell or solicitation of any offer to buy any securities or financial instruments or any advice or recommendation with respect to such securities or other financial instruments. The distribution of this document in certain jurisdictions may be restricted by law. Recipients are required by the Group to inform themselves about and to observe any such restrictions. No liability to any person is accepted in relation to the distribution or possession of this document in any jurisdiction.
Some of the information in this announcement may contain projections or other
About
*Attributable to shareholders, excluding the effects of the investment in IPJSC Yandex.
Related News